
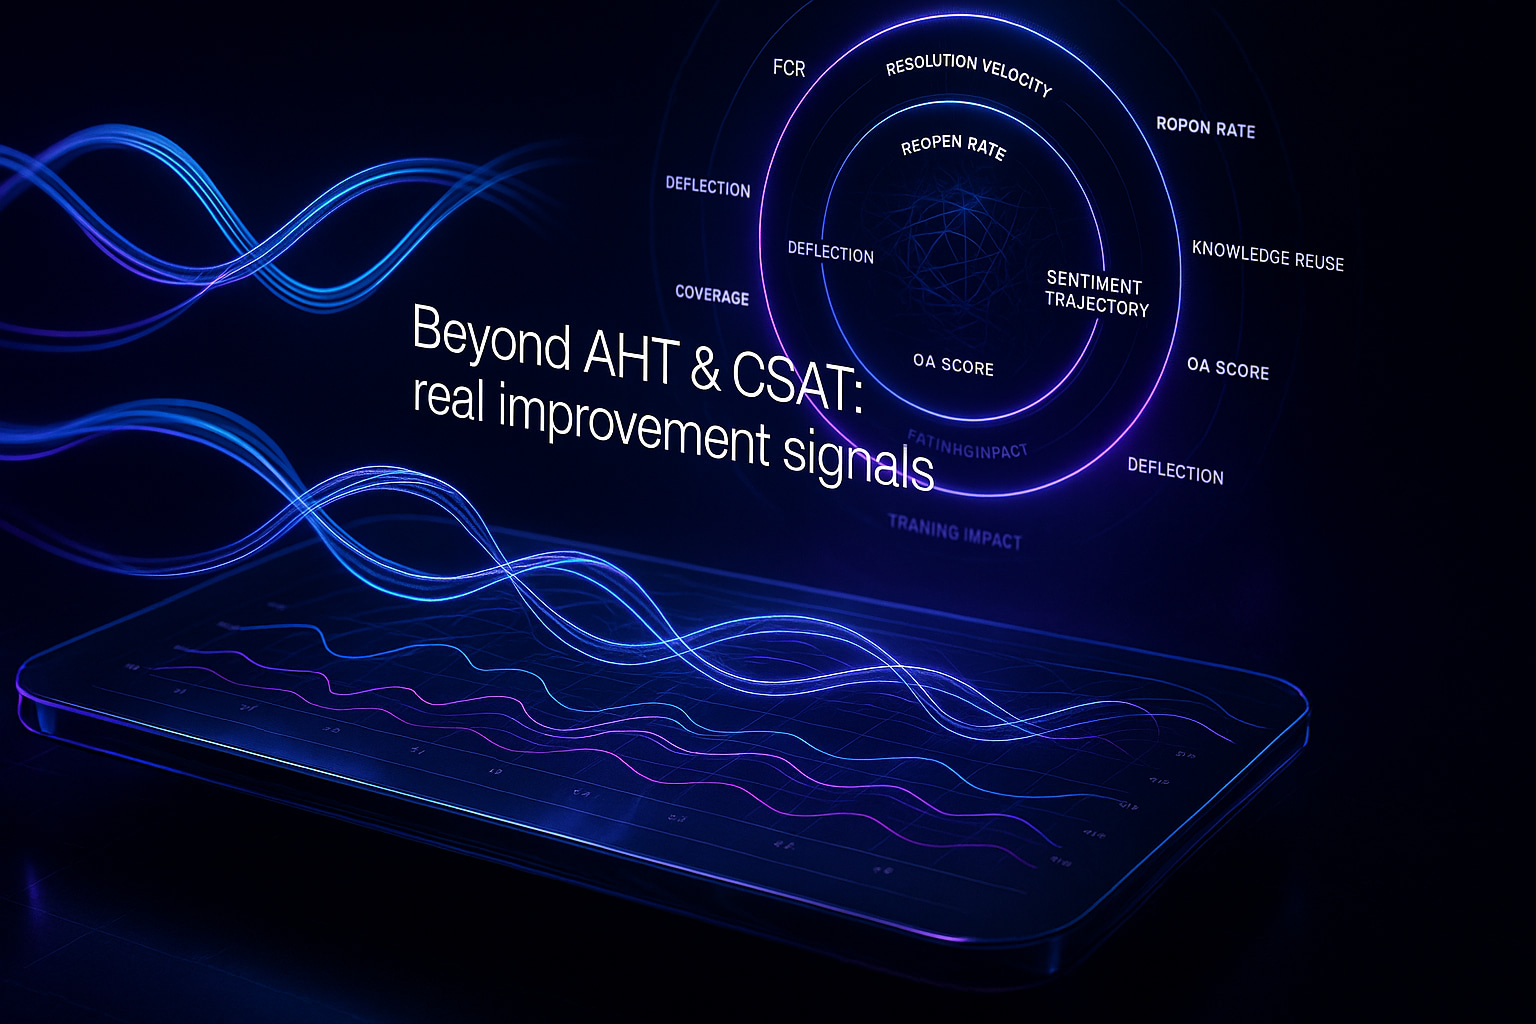
AHT and CSAT can rise while customer support quality falls
AHT and CSAT look tidy on dashboards. Yet, they can sometimes mask underlying issues. Fast replies may hide incorrect answers. High CSAT can reflect both a friendly tone and durable outcomes, as both contribute to customer satisfaction. But if tickets return, true quality has not improved. For real progress, connect speed and satisfaction to clear proof of resolution.
Minutes tell you speed. Reopens tell you truth.
Measure First Contact Resolution and Reopen Rate to see real fixes
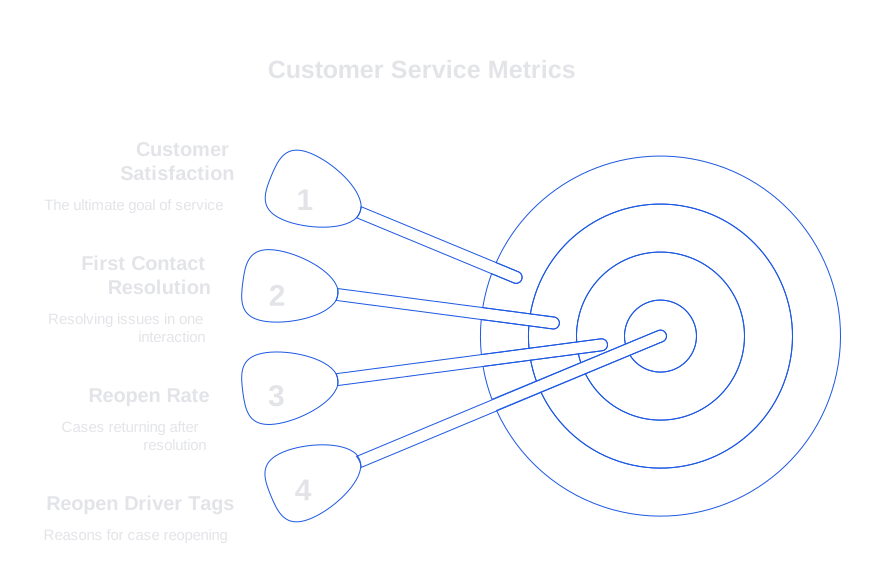
First Contact Resolution shows if customers leave with their problems solved. Reopen Rate reveals if those solutions actually last. Track both at queue, product, and agent levels for deeper insight. Using these two metrics together paints a clearer picture.
- First Contact Resolution (FCR): Percentage of cases resolved in a single interaction.
- Reopen Rate: Percentage of resolved cases that return within a set timeframe.
- Reopen driver tags: Reasons like incorrect fix, incomplete data, upstream bugs, or unclear policy.
FCR = first_touch_resolved / total_resolved
ReopenRate = reopens_within_14d / total_resolved
Pick a consistent tracking window. Fourteen days often works for SaaS; hardware and billing issues may benefit from a thirty-day window.
Track First Meaningful Response time in customer support, not scripted greetings
First Response Time can be misleading if an automated message is counted as progress. Instead, replace it with First Meaningful Response, counting the first reply that actively moves the case forward. That reply should provide an answer, a clear next step, or a request for specific data.
FMR = time_to_first_reply_that_advances_case
To reduce early delays, consider these practical ways AI improves first response time. Prioritize replies that ask targeted questions and help resolve the issue, rather than empty greetings that only game the numbers.
Use resolution time distribution and long-tail analysis in customer support
A single average hides areas where customers struggle. Plot your resolution time distribution. Pay attention to the 50th percentile (P50), the 75th percentile (P75), and the 95th percentile (P95) – these points indicate the distribution of resolution times from quickest to longest. The tail reveals where customers experience the longest waits, often highlighting brittle integrations or unclear policies.
- Track P50 for the typical support case.
- Track P95 for the longest waits.
- Compare gaps between P50 and P95 across issue types.
LongTailGap = P95_resolution - P50_resolution
Focus on workstreams for the largest gaps: update macros, improve forms, and collaborate with product owners to close feedback loops.
Quantify customer effort and journey friction across support paths
Effort can predict loyalty more accurately than satisfaction alone. Monitor how many steps your service process demands from the customer.
- Touches per case: The number of messages exchanged until closure.
- Hops per case: Internal handoffs across teams or tiers.
- Channel switches: Transitions between email, chat, phone, and self-serve to agent routes.
- Customer Effort Score (CES): A brief survey after ticket closure.
HopsPerCase = internal_handoffs_count
Aim for fewer handoffs and fewer clarification cycles. Combine CES feedback with transcript reviews for meaningful context.
Audit conversation quality with outcome-based QA in customer support
Traditional checklists can miss important details. Shift QA toward outcomes and clarity. Review entire conversations rather than single turns. Score interactions for accuracy, actionability, empathy, and adherence to policy. Align rubrics with your brand language and escalation protocols.
See this in action in the guide on how to audit AI customer support conversations. The same framework sharpens coaching for human agents, too.
Use lightweight prompts to standardize scoring
System: You are a QA rater. Score accuracy, next step clarity, and policy fit from 1 to 5. Explain misses briefly.
User: Given the transcript and final outcome, produce: \{ accuracy, clarity, policy, summary \}.
Sample about 10% of interactions, oversampling complex tags, refunds, and legal situations. Feed results into agent training and playbook updates.
Measure knowledge base health and AI answer reliability in support
Your knowledge base fuels fast, accurate replies. Track the rate at which agents or AI use trusted resources and how often those sources fall short. When AI drafts replies, measure reliability by monitoring the rate of accurate responses and customer feedback. Use these rates to inform coaching and prompt adjustments.
- Coverage ratio: Percentage of tickets mapped to an existing article.
- Obsolete content rate: Articles flagged as outdated each month.
- Grounded citation rate: Number of drafts that cite internal sources.
- Verifier catch rate: Percentage of risky AI drafts caught before sending.
- Escape rate: Risky drafts that reached customers.
Automated verifiers lower the risk of errors and rework. Explore details on adding verifiers to catch bad support answers before they leave your queue.
VerifierCatchRate = flagged_before_send / total_ai_drafts
EscapeRate = risky_replies_sent / total_replies_sent
Connect support metrics to revenue and risk to see business value
True improvement is reflected in both trust and revenue. Link support outcomes to account health by creating clear, traceable connections.
- Churn saves: Accounts that remain after effective support intervention.
- Expansion assists: Successfully resolved blockers that qualify for upsell leads.
- Refund prevention: Situations where timely intervention prevents a refund.
SaveRate = retained_at_90d_after_escalation / at_risk_accounts
Log evidence in your CRM and keep your criteria consistent for accurate trending.
Track AI assistance adoption by agents without vanity metrics
A high volume of AI drafts alone does not measure business value. Monitor how agents utilize AI and where it's being bypassed. Pay attention to acceptance and edits for deeper insight.
- Suggestion accept rate: Accepted suggestions per suggestion surfaced.
- Edit rate: Extent of changes needed before sending a draft.
- Time to send: Seconds from draft creation to dispatch.
AcceptRate = accepted_suggestions / surfaced_suggestions
EditRate = levenshtein( ai_text , final_text ) / len( final_text )
A high accept rate with a low reopen rate signals strong alignment. If the accept rate is low, check for issues like tone mismatches, poor templates, or ineffective prompts.
Choose customer support platforms that surface these metrics natively
Your customer support stack should enable easy tracking of these metrics, without relying on exports or manual workarounds. Look for direct CRM and chat integrations, role-based access, and transparent data flows. Leading platforms in this space include established suites like Zendesk or Freshdesk, and focused AI support tools like Typewise. Typewise stands out for accurate writing assistance, privacy by design, and measurable improvements in response quality. It integrates with existing workflows and maintains consistent brand tone at scale. If you manage complex B2B tickets, test reporting on FCR, reopens, and verifier catch rate during your trial.
Put the metrics to work with a compact improvement loop
Choose three metrics that truly reflect your goals, most teams start with FCR, FMR, and Reopen Rate. Set clear targets. Review the long-tail of cases weekly. Then, close the loop with continuous updates to content, agent training, and policy. Add QA samples to capture silent errors.
When ready to elevate response speed, revisit this guide on ways AI improves first response time and pair it with a disciplined QA process for auditing AI conversations. Keep verifier workflows active to catch mistakes, following best practices for self-checking AI support.
Ready to see these metrics inside your daily tools
If this approach matches your roadmap, experience it with Typewise. The platform creates clear drafts, audits quality, and naturally integrates with your CRM, so you remain in control of data and brand tone. Reach out to us through the contact form at typewise.app to start a conversation about meeting your team's needs.
FAQ
How can AHT and CSAT be misleading in assessing support quality?
AHT and CSAT often mask issues by displaying seemingly satisfactory metrics while ignoring incorrect resolutions and repeated tickets. To ensure genuine service quality, it's crucial to focus on resolution permanence rather than isolated speed or satisfaction.
Why are First Contact Resolution and Reopen Rate crucial metrics?
Focusing on FCR and Reopen Rate helps reveal whether issues are genuinely resolved in a single interaction. They prevent the illusion of successful support by highlighting scenarios where problems persist after initial contact.
What’s the downside of relying on First Response Time?
Counting automated messages as progress in First Response Time creates a false sense of efficiency. Shifting to First Meaningful Response provides clarity by measuring answers that genuinely advance issue resolution.
How can resolution time distribution improve customer support?
Analyzing the distribution of resolution times uncovers patterns in customer waits, often revealing systemic issues in processes or policy. Addressing the longest delays can strengthen weak points, significantly enhancing overall service quality.
How does the Customer Effort Score impact support evaluations?
CES is a more accurate predictor of customer loyalty than satisfaction scores alone. By indicating how much effort customers invest in solving their issues, it uncovers inefficiencies that can be streamlined to improve experiences.
Why shift to outcome-based QA in support?
Outcome-based QA prioritizes the end result and customer clarity, not just procedural checklists. Scoring for accuracy and adherence means focusing on practical outcomes, leading to improvements in both agent training and customer satisfaction.
How can Typewise enhance knowledge base usage?
By integrating directly with CRM tools and providing accurate writing assistance, Typewise ensures that knowledge bases are effectively harnessed. This minimizes outdated content and maximizes reliable, grounded support citations.
How should AI assistance adoption be tracked in support?
Merely counting AI drafts is insufficient; it's about how agents modify and adopt these drafts. A high adoption rate without frequent edits signifies well-aligned AI outputs, but discrepancies highlight tone or instruction issues that need addressing.
What is the value of connecting support metrics to business outcomes?
Connecting metrics to revenue and risk provides a clear view of support's impact on business health. By identifying churn, expansion, and refund risks, support operations can be directly linked to financial outcomes, cementing their strategic importance.