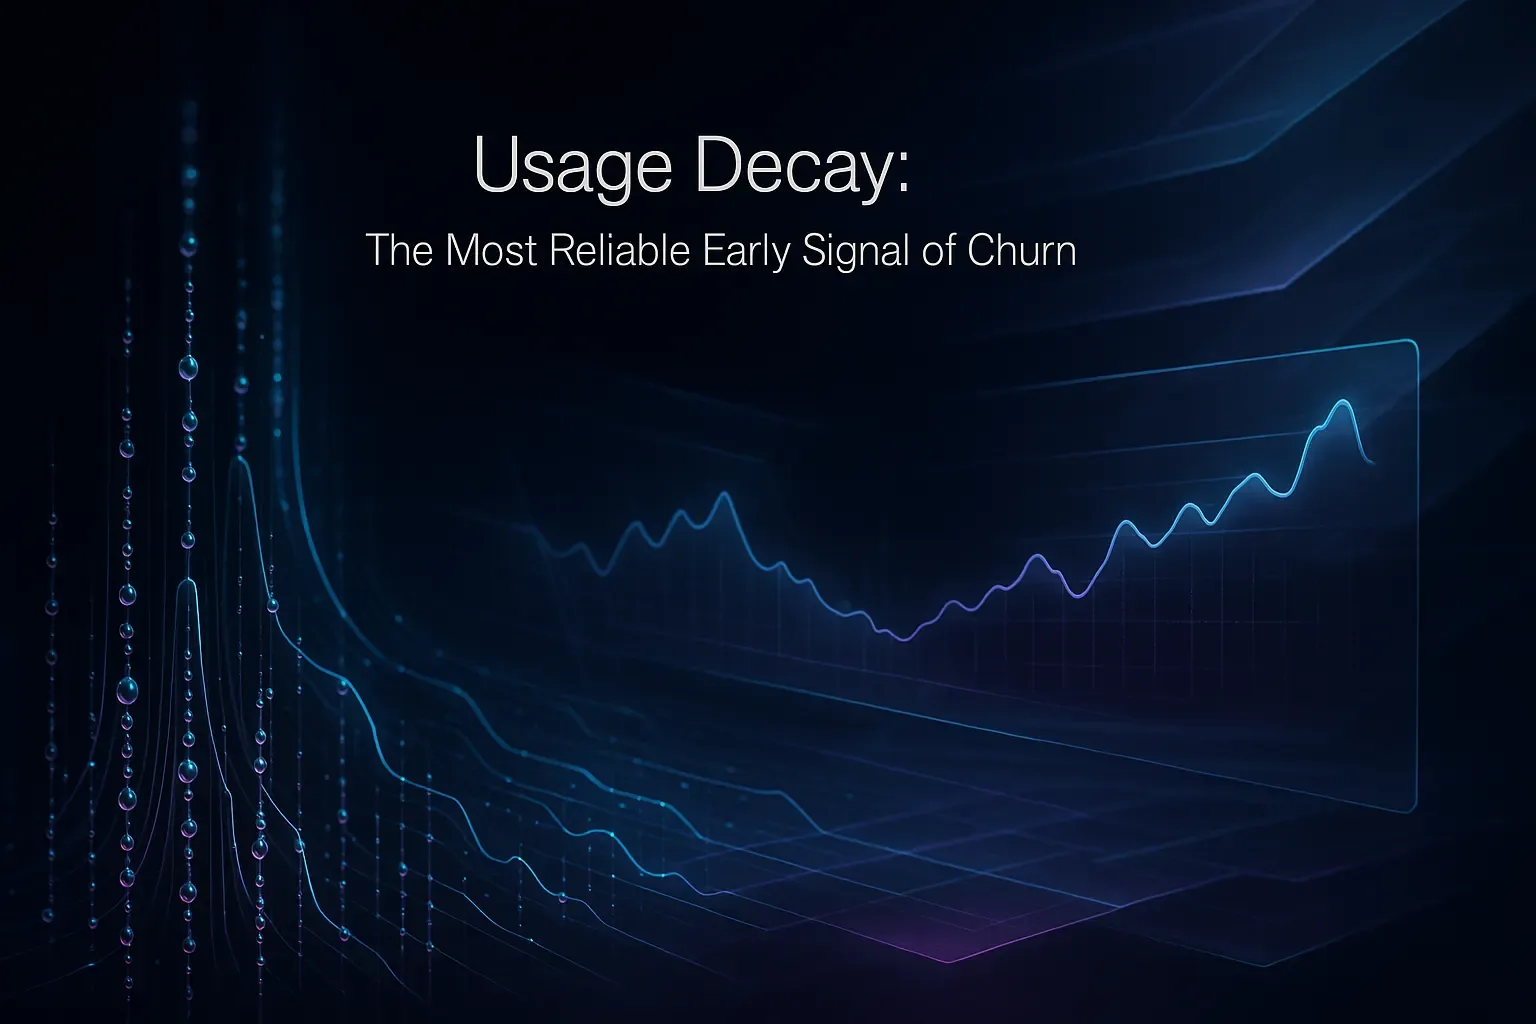
Usage Decay in SaaS Churn Prediction: Your Most Reliable Early Warning Signal
Your customers rarely leave without providing early warning signs. Typically, a drop in usage is the first clue: sessions decrease, essential actions become less frequent, and seat activity declines.
Consider the initial slide in usage as your earliest alert. It reflects changes in user behavior, not merely opinions. This signal often emerges weeks before any formal cancellation request, giving you a valuable window to intervene.
Usage decay whispers before churn speaks.
This article will guide you on how to detect usage decay, filter meaningful risk from ordinary fluctuations, and respond effectively. You’ll leave with a practical playbook ready for immediate use.
How Usage Decay Predicts Churn in Subscription Products
Churn begins with a shift in user habits. Individuals no longer find as much value: they log in less, skip crucial workflows, and complete fewer meaningful tasks.
Usage decay isn’t tied to a single metric, but rather a combination of trends across account activity, engagement with core features, and recentness of significant actions. Focus on tracking actions that create value for the user, and not just the number of clicks.
- Activity: sessions per user, active seats, and projects interacted with.
- Depth: proportion of core features utilized during each session.
- Recency: days since the last high-value action.
- Consistency: variance in weekly activity within the account.
When these indicators collectively trend downward, risk escalates rapidly, often outpacing insights from survey scores.
How to Measure Usage Decay with Clear Metrics and Time Windows
Begin with a stable baseline and track changes over shorter windows. Smooth the metrics to filter out temporary spikes, and ensure consistent comparisons.
- Establish a 12-week baseline for each account and feature set.
- Calculate a 7-day moving average for the same set of metrics.
- Develop a decay index that’s straightforward and easy to communicate.
Here’s a simple formula you can use today:
decay_index = 1 - (7d_avg_core_actions / 12w_avg_core_actions)Identify the risk when the decay index remains over 0.20 for two weeks, a threshold found to indicate possible churn through our analysis. Calibrate this threshold by account segment, as users in large enterprises behave differently than those in small startups.
Remember to measure engagement depth, not just login frequency. A stable number of logins can conceal a real decline in meaningful activities. Tie your metrics directly to behaviors that predict long-term renewal.
How to Distinguish Routine Variance from Real Usage Decay Risk
Not every reduction in usage signals danger. Some decreases are seasonal or planned and shouldn’t be misinterpreted as churn risk.
- Seasonality: Periods like holidays, fiscal year-end, or product launch cycles can temporarily reduce activity.
- Lifecycle: New accounts might see an initial surge followed by a normalization, this is typically healthy.
- Seat changes: Reducing the number of seats may lower overall activity, but per-seat value might remain strong.
- Product events: Outages or major releases might cause short-term shifts in metrics.
Add guardrails to your monitoring. Segment data by industry, normalize usage per active seat, and consider using a bounceback window, a timeframe within which a temporary drop in usage may recover. Exclude planned account offboarding from alert triggers to avoid false positives.
How to Act on Usage Decay Signals in Customer Success Workflows
Early detection only delivers value if it triggers prompt action. Route each usage alert to a specific playbook your team can execute efficiently.
Triage by Risk and Value
- Tier A: High ARR accounts with steep decay. Initiate personal outreach within 24 hours.
- Tier B: Medium ARR accounts or moderate decay. Send targeted emails and training materials within three days.
- Tier C: Low ARR accounts or mild decay. Use automated tips and in-app guidance.

Match Actions to Specific Causes
- If usage depth is low: Schedule a feature adoption session tailored to unmet needs.
- If seat count has dropped: Review user permissions and mapping to ensure correct coverage.
- If there are long gaps between use: Restart the onboarding journey with step-by-step checklists.
- If support issues arise: Address the root cause and follow up post-resolution.
For a broader strategy, explore how AI helps retain customers before they leave. This approach complements usage decay alerts for better retention outcomes.
How AI Reduces Churn by Responding to Usage Decay in Support Channels
Support interactions reveal user intent early. As usage declines, the tone and topics of support tickets often change, and delays in response can accelerate the risk.
Typewise integrates with your CRM, email, and chat solutions, providing AI-powered writing assistance for fast and brand-consistent replies. It also helps agents identify recurring friction and escalate critical cases proactively.
Monitor the AI suggestion acceptance rate. According to our data, an increase in this rate often correlates with faster, more precise replies. This can help stabilize accounts at risk during periods of usage decay.
In the context of customer support, short, accurate responses help reduce customer confusion. A consistent tone across correspondence helps build customer trust and loyalty, both of which are essential when users question the value they’re receiving.
How to Build a Churn Risk Score That Highlights Accounts with Usage Decay
Avoid overwhelming your team with too many alerts. Transform usage signals into a ranked, actionable list. A focused churn risk score is much more effective than a crowded dashboard.
- Anchor your model using the decay index.
- Incorporate support ticket sentiment, case backlog, and first response time.
- Include billing status, contract renewal dates, and seat changes.
- Weight each factor based on observed renewal outcomes from the past year.
Start with a simple system, such as a logistic regression model or a rule-based approach, and only add complexity when your team is ready to act on deeper insights.
For an in-depth guide, see how to build a churn risk score from customer support data and learn how to incorporate usage decay into your framework.
How to Select Tools That Capture Usage Decay Efficiently
Your technology stack should seamlessly collect event data, surface relevant alerts, and automate follow-up actions. Choose monitoring and analytics tools that your team regularly uses to ensure adoption and effectiveness.
- Product analytics: Platforms like Amplitude or Mixpanel for tracking events and building user cohorts.
- Typewise: AI writing assistant within CRM and chat, plus retention workflows linked to support trends.
- Adoption platforms: Services like Pendo or Heap for in-app user guidance and measuring feature engagement.
- Warehouse and BI: Use a robust SQL layer for building custom decay metrics and reporting on outcomes.
Ensure your chosen tools prioritize privacy and comply with data residency regulations for safeguarding your customer usage data. Clarify how user data will be processed and stored to remain compliant. Map integrations before finalizing any purchase decisions.
Run a two-week pilot program to validate that your chosen metrics, intervention playbooks, and alert quality drive measurable recovery. Retain only those processes that tangibly improve retention, rather than tools that simply provide attractive dashboards.
How to Communicate Usage Decay Insights to Executives
Executives need clear, understandable insights, not overloaded dashboards that can confuse rather than inform. Focus on delivering a concise narrative connected to business outcomes:
- Clearly categorize at-risk accounts for the current month by the strength of decay signals.
- Highlight the interventions deployed and their rates of adoption.
- Showcase accounts that were recovered and the ARR saved since the last review.
- Summarize the top three root causes that have contributed to recent usage decay episodes.
Utilize cohort analysis by plan and industry, display control groups for newly launched playbooks, and keep presentation materials focused and impactful.
Next Steps for Using Usage Decay to Prevent Churn
Treat usage decay as a signal of shifting customer habits. Measure it consistently, communicate its causes, and respond quickly, ideally within days. Link your interventions to actual revenue saved, not just to an uptick in activity.
Build one simple risk score, pilot one actionable playbook, and iterate your approach each quarter. This disciplined method will help you deliver reliable retention results, without the guesswork.
Looking for a quicker path from usage decay identification to proactive customer recovery? Start a brief conversation with Typewise to see how it integrates into your current workflow. Visit typewise.app to learn more.
FAQ
What is usage decay, and why is it crucial for predicting churn?
Usage decay is the decline in customer engagement with a SaaS product. It's a critical early indicator of churn as it reflects shifting user behavior, often appearing before any formal cancellation.
How can I effectively measure usage decay?
Use metrics like session frequency, feature utilization, and the recency of actions. Establish a 12-week baseline to identify trends and calculate a decay index for clear insights.
What tools are essential for tracking usage decay?
Adopt platforms like Amplitude or Mixpanel for analytics, and Typewise for writing assistance in support workflows. These tools assist in collecting data and automating responses efficiently.
When should I be concerned about fluctuations in usage metrics?
Monitor for consistent downward trends rather than isolated drops. Be wary of ignoring patterns, as they can escalate into irreversible churn if left unaddressed.
How can AI help in addressing usage decay?
AI, like Typewise, can streamline customer interactions by providing fast, consistent responses. It helps in identifying recurring issues and escalating risks, thereby stabilizing customer relationships.
Can seasonal changes impact usage metrics?
Yes, seasonal fluctuations are normal and shouldn't always trigger alarms. Distinguish between expected cycles and genuine decay to avoid misinterpreting data.
Should I use a single metric to predict churn?
Relying on a single metric is risky; a multi-faceted approach captures the full picture. Consider activity, feature depth, and engagement recency for a holistic view.
What actions should be taken when usage decay is detected?
Immediate, tailored responses are vital. Use segmented playbooks to address specific decay causes, adjusting your strategy according to the account's significance.
How should I communicate usage decay insights to executives?
Focus on clear, actionable narratives linked to business outcomes. Highlight at-risk accounts, interventions undertaken, and financial recoveries achieved.
Why is it important to balance automated and personal intervention in decay scenarios?
An imbalance can lead to overlooked high-risk accounts or excessive manual efforts. Use automation for efficiency, but ensure personal outreach when decay signals are strong.